 |  | ||||
| Grain Production and CarryOut | Release Date: July 11, 2012 |
| USDA 2011-2012 U.S. Grain CarryOver | Jul 2011-2012 Est | Analyst Est | Range | Jun 2011-2012 Est | 2010-2011 |
| Corn Soybean | .903 .170 | .840 .170 | .750-.905 .145-.200 | .851 .175 | 1.128 .215 |
| USDA 2012-2013 U.S. Grain CarryOver | Jul 2012-2013 Est | Analyst Est | Range | Jun 2012-2013 Est | 2011-2012 |
| Corn Soybean Wheat Cotton | 1.183 0.130 0.664 4.800 | 1.232 0.134 0.725 4.600 | 0.750-1.690 0.095-0.176 0.639-0.822 4.100-5.100 | 1.881 0.140 0.694 4.900 | 0.903 0.170 0.743 3.300 |
| USDA World CarryOver (MMT) | Jul 2012-2013 | Jun 2012-2013 | Jul 2011-2012 | Jun 2011-2012 |
| Corn Wheat Soybeans Soymeal Soyoil Cotton | 134.09 182.44 55.66 8.39 2.23 72.39 | 155.74 185.76 58.54 8.31 2.24 74.51 | 129.37 197.18 52.51 7.80 2.98 66.68 | 129.19 195.56 53.36 7.47 2.74 67.32 |
| USDA World Grain Production (MMT) | Jul 2011-2012 Estimate | Jun 2011-2012 | Jul 2012-2013 Estimate | Jun 2012-2013 |
| China Corn South Africa Corn Argentina Corn Brazil Corn Australia Wheat Argentina Wheat EU 27 Wheat Canada Wheat China Wheat Russia Wheat Ukraine Wheat Brazil Soybeans Argentina Soybeans China Soybeans | 192.80 11.50 21.00 70.00 29.50 14.50 137.40 25.30 117.90 56.20 22.10 65.50 41.00 22.10 | 192.80 11.50 21.00 69.00 29.50 14.50 137.40 25.30 117.40 56.20 22.10 65.50 41.50 13.50 | 195.00 13.00 25.00 67.00 26.00 12.00 131.00 27.00 120.00 49.00 13.00 78.00 55.00 12.60 | 195.00 13.00 25.00 67.00 26.00 12.00 131.00 27.00 120.00 53.00 13.00 78.00 55.00 12.60 |
| USDA Crop Production | Jan 2012 2011-2012 | Analyst Avg Est | Range | Dec 2011 2011-2012 | 2010 Production |
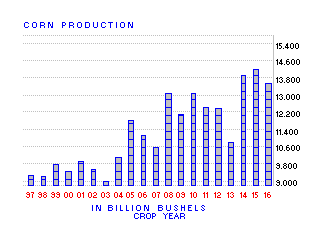
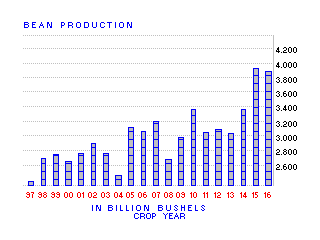
| Corn Soybeans Cotton (mil bales) | 12.358 3.056 15.674 | 12.280 3.042 15.64 | 12.170-12.375 3.010-3.080 15.360-15.830 | 12.310 3.046 15.827 | 12.447 3.329 2.208 |
| | | ||||
| USDA Crop Yields | Jan 2012 2011-2012 Est | Analyst Avg Est | Range | Oct 2011-2012 | 2010 Yield |
| Corn Soybeans | 147.2 41.5 | 146.4 41.3 | 145.3-147.5 41.8-41.0 | 146.7 41.3 | 152.8 43.5 |
| DISCLAIMER: This information is not to be construed as an offer to sell or a solicitation or an offer to buy the commodities herein named. The factual information of this report has been obtained from sources believed to be reliable, but is not necessarily all-inclusive and is not guaranteed as to the accuracy, and is not to be construed as representation by our firm. The risk of loss when trading futures and options is substantial. Each investor must consider whether this is a suitable investment. Past performance isnot indicative of future results. |